
As competition and buyer empowerment compound, customer experience (CX) is proving to be the only truly durable competitive advantage. Organizations must learn how to measure, manage, and act on customer experience KPIs and metrics so that they can deliver experiences that lead to increased loyalty, lower churn, more referrals, positive word of mouth, and higher-value customers.
- Companies that earn $1 billion annually can expect to earn on average an additional $700 million within 3 years of investing in customer experience.
- Customer-centric companies are 60% more profitable than companies that don’t focus on customers.
As your organization starts your customer experience management efforts, you need to consider how to measure it. CX is a multi-layered concept, and to truly understand customer experience at scale, you need to have a good understanding of customer experience KPIs and metrics.
How to Measure Customer Experience
Measuring customer experience is a strategic imperative that helps your company build strong, long-lasting relationships with your customers, stay competitive, and adapt to changing market dynamics.
Measuring CX requires a layered approach that can include in-depth user interviews and gathering data at key points of contact, as well as tracking customer experience metrics like NPS, CSAT, and CES, among others. It is an ongoing process that requires attention to customer feedback, continuous improvement, and a commitment to delivering value.
It also involves collecting and connecting customer experience data from every touchpoint and channel for a complete view of the customer journey. After all, customers use a variety of channels to interact with your brand, such as your store, website, mobile app, contact center, social media, online review websites, and so much more.
As your company looks to measure customer experience KPIs and metrics, it’s important to integrate data from all the touchpoints and channels that matter to your business so that metrics are not analyzed independently of the broader experience.
Keep in mind that no single customer experience KPI or metric will give you a complete picture, and you will have to discover how to adapt the metrics you’re tracking to your business case. Nonetheless, various customer experience survey methodologies and metrics are used across industries and serve as a great place to start as you grow your program.
What Are Customer Experience KPIs and Metrics?
Customer experience KPIs and metrics are indicators that enable your organization to gain a comprehensive understanding of your customer experience performance. Regularly tracking and analyzing these metrics can guide your business as you look to make informed decisions that enhance customer satisfaction and loyalty.
Net Promoter Score (NPS)
Net Promoter Score (NPS) is a CX metric that surveys customers based on one question: “On a scale of 0 to 10, how likely are you to recommend us to a friend or colleague?”
- Promoters (score 9-10) are loyal, satisfied customers who will help fuel your business growth by buying and referring other customers to your business.
- Passives (score 7-8) are also satisfied customers, but their lack of enthusiasm may render them vulnerable to offerings from the competition.
- Detractors (score 0-6) are unhappy customers who may impede your growth and spread negative word of mouth about your business.
To calculate your Net Promoter Score, simply subtract the percentage of Detractors from the percentage of Promoters.

NPS is a valuable tool for measuring not just customer experience, but also customer loyalty, since it transcends single experiences. It is often referred to as a brand or relationship metric. The NPS question asks the customer to draw on the sum of their experiences with your company, not just the most recent, making it a good indicator for repurchasing (and growth). As a result, it is often considered a “board-level” metric.
NPS is a great place to start when you’re looking to measure customer experience. However, if you would like to learn more about the experience you provide at specific touchpoints or transactions along your customer’s journey, Customer Satisfaction Score (CSAT) should be one of the customer experience KPIs to track.
Customer Satisfaction Score (CSAT)
Customer Satisfaction Score (CSAT) is the most popular transactional metric. A customer satisfaction survey asks a customer how satisfied they are with a recent interaction — often a purchase or a customer service call — on a rating scale. CSAT is flexible and highly customizable. In some cases, emojis (smileys, frowns) are used instead of numerical scales to overcome any language barrier.
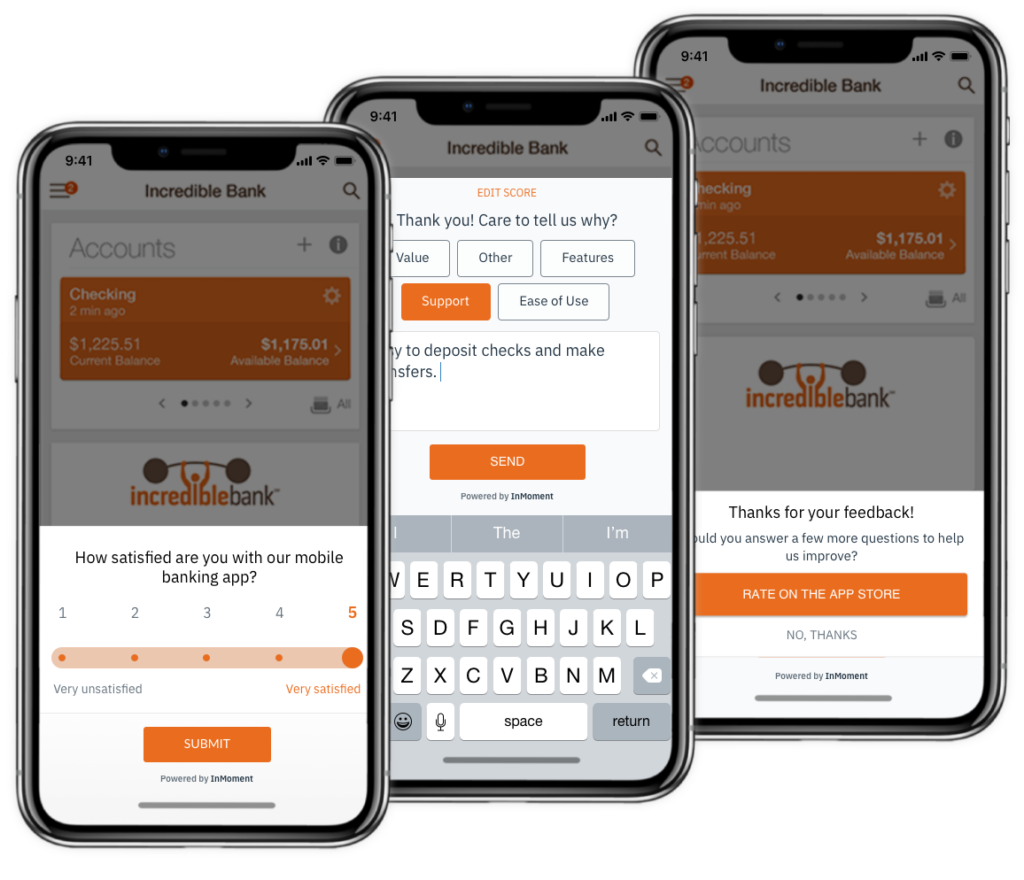
In the realm of CX, a short CSAT survey is most often used to gauge customer satisfaction with interactions with support personnel. It’s a great tool for identifying support agents who may need more training or for quantifying the impact of your last team-wide training effort. You will need to dig into the qualitative feedback you receive to understand which attributes of satisfaction are most important to your customers and which areas require improvement.
A related survey metric is the PSAT or Product Satisfaction Score. This is an adaption of the CSAT survey that is popular with software developers and advocates of product-led growth. An example is an in-app survey that asks a software user, “How satisfied are you with this product or feature?” The specific, contextual feedback that users provide in a PSAT survey helps to prioritize a roadmap of product improvements.
Customer Effort Score (CES)
Customer Effort Score (CES) surveys ask the customer, “How much effort did you have to expend to handle your request?” This is scored on a numeric scale. It’s a customer service metric that is typically used to improve systems that may frustrate customers.
Customers may then respond on a 5- or 7-point scale, and scores are calculated simply by getting the average of all the collected responses. Reducing customer effort can be a valuable marketing investment that makes your brand stand out in a sea of unaccommodating, not-very-helpful competitors.

CES advocates believe that when it comes to customer service or support, “effortlessness” is the most relevant attribute of customer satisfaction. Tracking Customer Effort Score helps you identify and remove obstacles, and solve problems, so your customers can find success with ease. According to the Harvard Business Review, CES can predict repurchasing even better than CSAT, making it a go-to critical metric for companies that depend heavily on successful onboarding and customer success to lay the foundation for repeat purchases.
Churn Rate
Customer churn or attrition is defined as the loss of clients or customers and is also one of the first and most obvious indicators of customer dissatisfaction. This makes churn rate one of your most important customer experience metrics; it is especially critical if your business model is subscription-based (example: software companies and membership-based services).
To calculate the customer churn rate, first determine the period for which you want to calculate the churn rate (e.g., monthly, quarterly, or annually). Then count the customers at the start of the period, as well as the number of customers lost during the period. Use the following formula to calculate the churn rate:
- Churn Rate (C) = (Number of Customers Lost % Number of Customers at the Start of the Period) × 100
This formula expresses the churn rate as a percentage.
It’s important to note that while calculating the churn rate provides valuable insights, understanding the reasons behind customer churn is equally crucial. Analyzing customer feedback, conducting surveys, and identifying patterns can help you take proactive measures to reduce churn and improve overall customer satisfaction.
Tracking churn rate will also allow you to see and apply new ways to handle the challenging situation of customers canceling their plans or subscriptions as well as to overcome other roadblocks to fostering customer loyalty. Organizations that consistently keep an eye on this customer experience KPI are also better at predicting if and when a customer is at risk of churning so that they can take the next step and close the loop with at-risk customers.
Retention Rate
Customer retention rate is a customer experience KPI that measures the percentage of customers your business retains over a specific period. It’s a great way to assess your customer experience performance as well as the effectiveness of your customer retention strategies. A higher customer retention rate typically indicates that a company is keeping its existing customers satisfied.
To calculate your retention rate as a percentage, simply follow this formula: customer retention Rate = (Retained Customers % Number of Customers at the Start of the Period) × 100.
Monitoring and improving customer retention rates are essential for the long-term success of your organization. A high retention rate is often associated with increased customer lifetime value (CLV) and reduced customer acquisition costs. To make the most out of this metric, you should complement retention rate analysis with customer feedback to continuously enhance the customer experience and address potential areas of concern.
Customer Lifetime Value (CLV)
Customer lifetime value (CLV) is a metric that represents the predicted net profit your company can expect to earn from a long-term relationship with a single customer. This will tell you what a single customer is worth to your business throughout the course of the relationship.
Learning how to measure and increase customer lifetime value will help your company forge stronger customer relationships and achieve a competitive edge in the market. Increasing CLV will also improve the long-term profitability of your business, allowing your company to identify which customers are most valuable over time and determine how to allocate resources more efficiently to serve and retain those customers.
The simplest formula for calculating customer lifetime value is: CLV = customer value (average purchase value x average purchase frequency) x average customer lifespan.
First Response Time (FRT)
First Response Time (FRT) is a crucial metric for measuring customer experience, particularly in customer support and service environments. It represents the time it takes for a customer to receive an initial response after making a query or reporting an issue.
This CX metric matters because quick responses contribute to higher customer satisfaction. Customers appreciate the timely acknowledgment of their concerns, which demonstrates that the company values their time and is committed to addressing their needs promptly. First Response Time can even influence your company’s reputation: brands that are known for quick and efficient customer service are likely to be perceived positively, while a reputation for slow response times can harm your overall brand image.
Average Resolution Time
Average Resolution Time is a customer experience KPI that provides insights into customer service efficiency and directly impacts customer experience and satisfaction. By tracking this actionable CX metric, your company can set goals to reduce the time it takes to resolve issues, while also continually improving support processes, leading to an enhanced customer experience over time.
When quick and efficient issue resolution contributes to a positive overall experience, your company is better equipped to foster customer loyalty. Understanding how much time is typically spent on resolving customer issues can even help your company allocate resources appropriately. This can involve adjusting staffing levels, providing additional training, or implementing new technologies to improve efficiency.
CSAT vs NPS vs CES
There are always conversations around the three most popular customer experience KPIs: CSAT vs NPS vs CES. Which of these CX metrics are most suitable for your company? What are the advantages and limitations of each? These metrics differ in terms of the insights they provide and the areas of customer satisfaction they focus on.
CSAT captures satisfaction with specific interactions, NPS evaluates loyalty and advocacy, and CES assesses the ease of the customer experience. By utilizing a combination of these metrics, businesses can gain a more comprehensive understanding of customer satisfaction, identify areas for improvement, and develop strategies to enhance the overall customer experience.
Advantages
Net Promoter Score (NPS) is a useful customer experience KPI because it’s an easy-to-calculate metric that provides actionable insights. Your team can follow up with detractors to understand the reasons for their dissatisfaction and take corrective action. NPS also allows you to benchmark your score against competitors and industry standards, providing context for your overall performance.
Meanwhile, Customer Satisfaction Score (CSAT) surveys are relatively easy to administer and understand. They often use a simple scale and provide immediate feedback, with some surveys being conducted right after a specific customer interaction or transaction, providing real-time feedback.
Advocates of Customer Effort Score (CES) often highlight the ease with which they can gather actionable insights from responses. CES results often offer specific areas for improvement, helping companies identify and address high-impact pain points in the customer journey.
Limitations
For larger organizations, NPS on its own may be too simplistic of a metric. It helps you understand that customers have had a positive or negative experience, but not necessarily why that’s the case. NPS works best if paired with other customer experience metrics, or when you utilize a secondary follow-up question to investigate the customer experience in greater detail.
CSAT, meanwhile, may not provide the most comprehensive view of the overall customer experience since it focuses on satisfaction at a particular point in time. The interpretation of satisfaction scores can also vary between individual customers, and what one considers satisfactory might not be the same for another.
The same goes with CES: it may not necessarily capture the entire customer experience and may focus more on transactional aspects. Interpreting CES scores on their own also often requires a broader understanding of the context of the customer experience, and a low score doesn’t always indicate a systemic issue.
Should You Measure All the CX Metrics?
Given the advantages and limitations of the customer experience KPIs listed above, should you measure all these CX metrics?
The short answer is: no. While tracking and measuring as many CX metrics as possible can be helpful in understanding and improving your performance, it’s not always necessary or practical to monitor every possible KPI or metric. The choice of metrics is not even as important as you might think, since driving improvement is what’s important.
With that in mind, choose metrics based on what you’ll be able to do with the data they provide. Are the results going to enable you to take action? If not, don’t spend time on them. The selection of specific metrics should align with your business goals, industry, and the nature of your customer interactions. It’s also important to regularly reassess your customer experience KPIs and metrics to ensure they remain relevant as your business evolves.
How Can I Use KPIs to Improve Customer Experience?
Improving customer experience starts with tracking your current CX metrics, listening to customers, and analyzing data for insights that will be essential to forming an action plan. Keep in mind that this is a cycle that your organization has to do consistently and regularly.
Instead of sending out feedback or customer satisfaction surveys only once or twice a year, you may consider investing in a customer experience management software platform that enables your organization to achieve always-on listening. This means that you’re able to capture CX data and feedback from various touchpoints and channels, such as social media, website and mobile app analytics, call center transcripts, and online reviews, as well as from targeted surveys that deliver results in real time.
After you take these actions, you measure the response to your improvements and determine the success of your efforts. And once you’ve completed the cycle, you must do it all over again.
Tracked and managed the right way, the customer experience KPIs and metrics listed above should help support your organization’s commitment to putting customers first. They’re useful for collecting valuable sentiment data, generating actionable insights, and predicting future behavior. Most importantly, these metrics enable your organization to take the guesswork out of your strategy, accurately measure customer experience, and inspire more moments of customer delight.
Your Next Steps: Taking Action
Customer experience involves multiple touchpoints and interactions across various channels and stages of the customer journey. Capturing and measuring the entire, multi-faceted experience requires a comprehensive approach that takes into account diverse customer interactions.
This is where InMoment comes in. Combining award-winning technology with expert services in customer experience measurement and management, InMoment helps today’s top brands deploy programs that are designed to measure customer experience KPIs and metrics in ways that are simple, speedy, and scalable.
References
SuperOffice. 32 Customer Experience Statistics You Need to Know for 2024 (https://www.superoffice.com/blog/customer-experience-statistics/). Access 12/1/2023.
Forbes. 50 Stats That Prove The Value Of Customer Experience (https://www.forbes.com/sites/blakemorgan/2019/09/24/50-stats-that-prove-the-value-of-customer-experience/). Access 12/1/2023.
Harvard Business Review. Stop Trying to Delight Your Customers (https://hbr.org/2010/07/stop-trying-to-delight-your-customers). Access 11/30/2023.
CHEAT SHEET
CX Metrics Cheat Sheet
Get Away From Confusion & Gain a Clear Understanding of Your Customer Experience with the Right Metric
This CX Metrics Cheat Sheet details the top three CX metrics leveraged by world-class programs:
- Net Promoter Score (NPS)
- Customer Satisfaction Score (CSAT)
- Customer Effort Score (CES)
You’ll gain an understanding of how they work as well as the pros and cons of each measurement so you can choose the best match for your business.
Download the cheat sheet and do away with segmented views of your customer experience and gain a clear, integrated understanding so you can take action today!